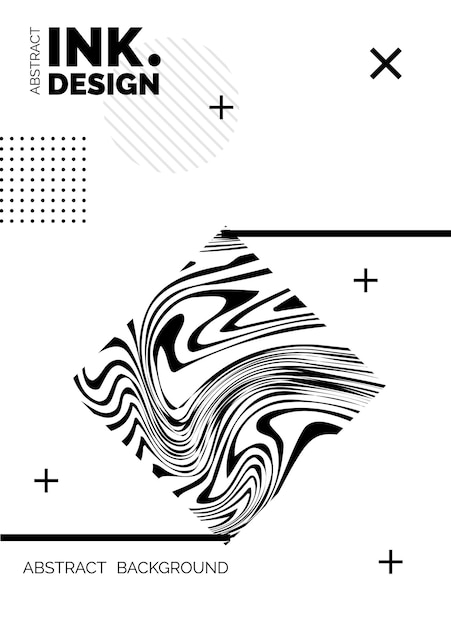
Vector Monochrome Field Visualization: Forces, Magnetic, Gravitational Fluctuations Chart
Enhance your scientific presentations and data visualizations with our free Vector Monochrome Field Visualization template. This versatile template is perfect for representing various forces, including magnetic or gravitational fluctuations, in a visually compelling manner. With its ultra-thin lines, it provides an elegant backdrop that seamlessly integrates with your scientific charts and diagrams.
Features:
- Energy Pattern: Visualize the energy distribution and patterns with precision using this template.
- Force Representation: Represent different forces, such as magnetism and gravity, with clarity and accuracy.
- Speed Pattern: Illustrate the speed patterns of forces to convey their dynamic nature convincingly.
- Black Line Design: The monochrome design with black lines ensures a sleek and sophisticated visual appeal.
- Arrow Pattern: Utilize arrow patterns to indicate the direction of forces, aiding in effective communication.
- Dark Abstract Background: The dark abstract backdrop enhances the visibility and prominence of your scientific data.
Frequently Asked Questions:
What file types are included in the download?
The template comes in EPS and JPG file formats, ensuring compatibility with a wide range of design software and applications.
Which category does this template belong to?
This Vector Monochrome Field Visualization template falls under the Vector Templates category, making it suitable for a variety of scientific and design projects.
Can I customize the template according to my needs?
Absolutely! The template is fully customizable, allowing you to adjust colors, line thickness, and other design elements to align with your specific requirements.
How can I effectively integrate this template into my presentations?
To seamlessly integrate the template into your presentations, export the chosen design as an image or vector file and import it into your preferred presentation software. Then, overlay your data or scientific charts on top of the monochrome field visualization to provide a visually comprehensive representation of your research or findings.
Download our free Vector Monochrome Field Visualization template now to elevate the visual impact of your scientific presentations and bring your data to life. Enhance your audience's understanding and engagement with this powerful and versatile design resource.


